| STRUCTURAL DESIGN - PART 02 | English
|
|
3. F.E. model of the arch After the preliminary analysis described above, more accurate structural analyses have been performed, starting with the creation of a F.E. model of the arch with the well-known computer-code SAP2000. The obtained results were compared with the ones of the preliminary analysis to check their reliability. The SAP2000 code allows only for linear elastic calculations of the structures, and consider a material with infinite strengths both in compression and in tension. Therefore, at the end of the analyses, it has been checked that the sections were not partialised. The arch model consists of "beam" elements that lie along the axis line of the actual arch (this condition is important to attain a reliable evaluation of the funicular polygon). In the F.E. model the dead loads of the following elements have been applied:
The mechanical characteristics of the material, calculated as approximate values, are: E= 100000 Kg / cm2 and n =0.15. The trend of the stress resultants attained are illustrated here at the sketch:
fig. 4 - Deformed Configuration
fig. 5 - Normal forces
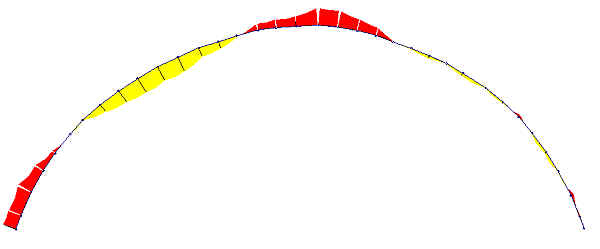
fig. 6 - Bending moments. In order to evaluate the reliability of the model, we have calculated the trend of the thrust line by dividing the bending moment by the normal force at each section. The trend of the curve of thrusts is represented (figure 07) in red, the arch is identified by means of continuous black lines, the envelope of the third medium lines by dotted black lines. Finally, the axis is identified by means of a black hatched and dotted line. It is useful to observe that the trend of the curve is limited within the third medium line. The axial thrust value is out of tolerance only in the area that corresponds to the central inertia core of the areas shown. The keystone section is the one that suffers the higher traction stress, with an eccentricity of the load from the axis line of 22.2 cm, that can be calculated with the following formula:
fig. 7 - Thrust line s t = 2 N / (3 u b) = 19.93 kg/cm2, where
that is the stresses are higher than the traction limit of the masonry. As in the past the former bridge did not exhibit stability problems and diffused cracking patterns, these stresses could not be present in the arch, which means that the actual bearing structure was formed by the arch and the overlying spandrels and slab. Moreover, these results highlight the deviation of the funicular polygon on the left side from the arch axis as opposed to the opposite arcade. The above considerations are confirmed by the stretching of the curved axis of the left arch.
fig. 8 - Section of arch. Notice the collapse of the abutment On the basis of the above results, a refined F.E. model was created. |
|
|
CREDITS: Intellectual property of this report and of the design drawings is owned by the University of Florence - Department of Civil Engineering author of the text: Prof.Eng. Andrea Vignoli – other contributes have been mentioned in related paragraphs © - General Engineering Workgroup - SOURCE: Final Design Report |
|